Market Outlook
August 17, 2016
Market Cues
Domestic Indices
Chg (%)
(Pts)
(Close)
Indian markets’ are likely to open on a Negative note tracing Global cues.
BSE Sensex
(0.3)
(88)
28,065
Nifty
(0.3)
(30)
8,643
The US markets were lower Tuesday after Federal Reserve officials made hawkish
comments despite anemic inflation data.
Mid Cap
0.6
70
12,824
Small Cap
(0.0)
(1)
12,213
The European markets finished in the red Tuesday, retreating from their highest level
Bankex
0.3
58
21,816
in seven weeks. The move was largely attributed to profit taking following the recent
run up in equities. The strong performance of the mining stocks helped to limit the
downside move.
Global Indices
Chg (%)
(Pts)
(Close)
Dow Jones
(0.5)
(84)
18,552
Indian markets fell modestly on Tuesday, as sluggish trade data as well as worrying
Nasdaq
(0.7)
(35)
5,227
retail and wholesale inflation figures stirred up concerns about the health of the
domestic economy.
FTSE
(0.7)
(47)
6,894
Nikkei
(1.6)
(273)
16,597
News Analysis & Result Review
Hang Seng
(0.1)
(22)
22,911
Result Review: Power Grid
Shanghai Com
(0.5)
(15)
3,110
Detailed analysis on Pg2
Investor’s Ready Reckoner
Advances / Declines
BSE
NSE
Key Domestic & Global Indicators
Advances
1,105
610
Stock Watch: Latest investment recommendations on 150+ stocks
Declines
1,639
994
Refer Pg5 onwards
Unchanged
164
60
Top Picks
CMP
Target
Upside
Volumes (` Cr)
Company
Sector
Rating
(`)
(`)
(%)
BSE
3,315
Amara Raja
Auto/Auto Ancillary
Buy
903
1,076
19.2
NSE
21,571
HCL Tech
IT
Buy
795
1,000
25.8
LIC Housing
Financials
Accumulate
548
582
6.3
Net Inflows (` Cr)
Net
Mtd
Ytd
Bharat Electronics
Capital Goods
Accumulate
1,236
1,414
14.4
FII
1,273
6,477
37,360
Navkar Corporation Others
Buy
200
265
32.8
More Top Picks on Pg3
MFs
(21)
(194)
8,594
Key Upcoming Events
Top Gainers
Price (`)
Chg (%)
Previous
Consensus
Date
Region
Event Description
Reading
Expectations
Pel
1,801
7.5
Aug 17
US
Industrial Production
0.6
0.3
Cipla
554
7.1
Aug 18
UK
Jobless claims change
0.4
9.0
Ncc
82
6.3
Aug 23
US
New Home sales
592.0
579.0
Eclerx
1,610
6.2
Aug 23 Germany
PMI Services
54.4
--
Adaniports
273
6.1
Aug 23 Germany PMI Manufacturing
53.8
--
6.(
More Events on Pg4
Top Losers
Price (`)
Chg (%)
Unitech
5
(16.9)
Religare
241
(8.0)
Rajeshexpo
435
(4.6)
Jpinfratec
8
(4.5)
Infratel
351
(4.3)
As on August 16, 2016
Market Outlook
August 17, 2016
Result Review:
Power Grid
State-run Power Grid Corporation reported a 33% growth in standalone net profit
at `1,801.77cr for the quarter ended June 30, 2016. The company had clocked a
net profit of `1,355.64cr in the year-ago period.
Total standalone income of the public sector undertaking (PSU) also rose by 31%
to `6,119.86cr in April-June quarter this fiscal as against `4,689.88cr during the
same quarter last financial year. Its total expenses were up at `2,457.49cr from
`1,933.24cr during the period under review.
The firm's revenues from transmission business rose to `5,950.88cr during the
June quarter from `4,579.0cr in the year-ago period. From consultancy, the
company's revenue was also higher at `121.56cr in April-June 2016-17 as against
`89.98cr in the same quarter last financial year. Income from telecom business
was at
`122.48cr in the first quarter compared to
`97.68cr during the
corresponding quarter last financial year
Economic and Political News
Gujarat Cabinet gives nod to 7th pay panel recommendations
Lower fresh NPAs in Q1 of FY17: RBI deputy gov
GST Bill to be passed in Haryana assembly in Monsoon session
Corporate News
Piramal Enterprises enters into an agreement to Acquire Ash Stevens Inc
JK Lakshmi Cement gets green nod for `120-crore expansion project
Tata Power Solar commissions 100 mw project in Andhra
Quarterly Bloomberg Brokers Consensus Estimate
Tata Power Co Ltd Consol - Aug 23, 2016
Particulars (` cr)
1QFY17E
1QFY16
y-o-y (%)
4QFY16
q-o-q (%)
Net sales
9,275
9,235
0.4
9,375
(1.1)
EBITDA
1,995
2,181
(8.5)
1,913
4.3
EBITDA margin (%)
21.5
23.6
20.4
Net profit
341
241
41.3
360
(5.3)
Market Outlook
August 17, 2016
Top Picks ★★★★★
Large Cap
Market Cap
CMP
Target
Upside
Company
Rationale
(` Cr)
(`)
(`)
(%)
To outpace battery industry growth due to better technological
Amara Raja Batteries
15,424
903
1,076
19.2
products leading to market share gains in both the automotive
OEM and replacement segments.
Uptick in defense capex by government, coupled with BELs
Bharat Electronics
29,659
1,236
1,414
14.4
strong market positioning, indicate good times ahead for BEL.
HCL Tech
1,12,148
795
1,000
25.8
Stock is trading at attractive valuations & factors all bad news.
Strong visibility for a robust 20% earnings trajectory, coupled
HDFC Bank
3,10,379
1,226
1,350
10.1
with high quality of earnings on account of high quality retail
business and strategic focus on highly rated corporates.
Back on the growth trend, expect a long term growth of 14% to
Infosys
2,41,397
1,051
1,370
30.4
be a US$20bn in FY2020.
Continues to grow its retail loan book at healthy pace with
LIC Housing Fin.
27,638
548
582
6.3
improvement in asset quality. Expect LICHF to post a healthy
loan book which is likely to reflect in a strong earnings growth.
Strong market positioning within the domestic AC markets to
Voltas
12,261
371
407
9.8
continue, EMP business set to revive
Source: Company, Angel Research
Mid Cap
Market Cap
CMP
Target
Upside
Company
Rationale
(` Cr)
(`)
(`)
(%)
Among the top 4 players in the consumer durables segment.
Bajaj Electricals
2,472
245
277
13.2
Improved profitability backed by turn around in E&P segment.
Strong order book lends earnings visibility.
Favourable outlook for the AC industry to augur well for
Cooling products business which is out pacing the market
Blue Star
4,726
496
527
6.3
growth. EMPPAC division's profitability to improve once
operating environment turns around.
Strong loan growth backed by diversified loan portfolio and
Equitas Holdings
5,911
176
235
33.3
adequate CAR. ROE & ROA likely to remain decent as risk of
dilution remains low. Attractive valuations considering growth.
Expectations of above average monsoon augurs well for
Goodyear India
1,243
539
631
17.1
Goodyear India as it derives ~50% of its turnover from farm
tyre segment.
Commencement of new projects, downtrend in the interest rate
IL&FS Transport
2,262
69
93
35.3
cycle, to lead to stock re-rating
Economic recovery to have favourable impact on advertising &
Jagran Prakashan
5,950
182
205
12.6
circulation revenue growth. Further, the acquisition of a radio business
(Radio City) would also boost the company`s revenue growth.
Speedier execution and speedier sales, strong revenue visibility
Mahindra Lifespace
1,754
427
554
29.6
in short-to-long run, attractive valuations
Massive capacity expansion along with rail advantage at ICD as
Navkar Corporation
2,846
200
265
32.8
well CFS augurs well for the company
Earnings boost on back of stable material prices and favourable
Radico Khaitan
1,239
93
125
34.3
pricing environment. Valuation discount to peers provides
additional comfort
Strong brands and distribution network would boost growth
Siyaram Silk Mills
1,012
1,079
1,347
24.8
going ahead. Stock currently trades at an inexpensive valuation.
Market leadership in Hindi news genre and no. 2 viewership
TV Today Network
1,731
290
363
25.1
ranking in English news genre, exit from the radio business, and
anticipated growth in ad spends by corporates to benefit the stock.
Source: Company, Angel Research
Market Outlook
August 17, 2016
Key Upcoming Events
Result Calendar
Date
Company
August 17, 2016
Radico Khaitan
August 18, 2016
India Cements, Transport Corporation of India
August 20, 2016
TVS Srichakra
August 23, 2016
Tata Power Co.
August 26, 2016
Tata Motors
Source: Bloomberg, Angel Research
Global economic events release calendar
Bloomberg Data
Date
Time
Country Event Description
Unit
Period
Last Reported Estimated
Aug 17, 2016
6:45 PM
US
Industrial Production
% Jul
0.60
0.30
Aug 18, 2016
2:00 PM
UK
Jobless claims change
% Change Jul
0.40
9.00
2:30 PM Euro Zone
Euro-Zone CPI (YoY)
% Jul F
0.20
0.20
Aug 23, 2016
7:30 PM Euro Zone Euro-Zone Consumer Confidence
Value Aug A
(7.90)
7:30 PM
US
New home sales
Thousands
Jul
592.00
579.00
1:00 PM Germany
PMI Services
Value Aug P
54.40
1:00 PM Germany
PMI Manufacturing
Value Aug P
53.80
Aug 24, 2016
11:30 AM Germany
GDP nsa (YoY)
% Change 2Q F
3.10
7:30 PM
US
Existing home sales
Million
Jul
5.57
5.55
Aug 26, 2016
6:00 PM
US
GDP Qoq (Annualised)
% Change 2Q S
1.20
1.20
2:00 PM
UK
GDP (YoY)
% Change 2Q P
2.20
Aug 30, 2016
1:25 PM Germany Unemployment change (000's)
Thousands Aug
(7.00)
Aug 31, 2016
7:30 PM
US
Consumer ConfidenceS.A./ 1985=100 Aug
97.30
97.00
Sep 01, 2016
2:00 PM
UK
PMI Manufacturing
Value Aug
48.20
Source: Bloomberg, Angel Research
Market Outlook
August 17, 2016
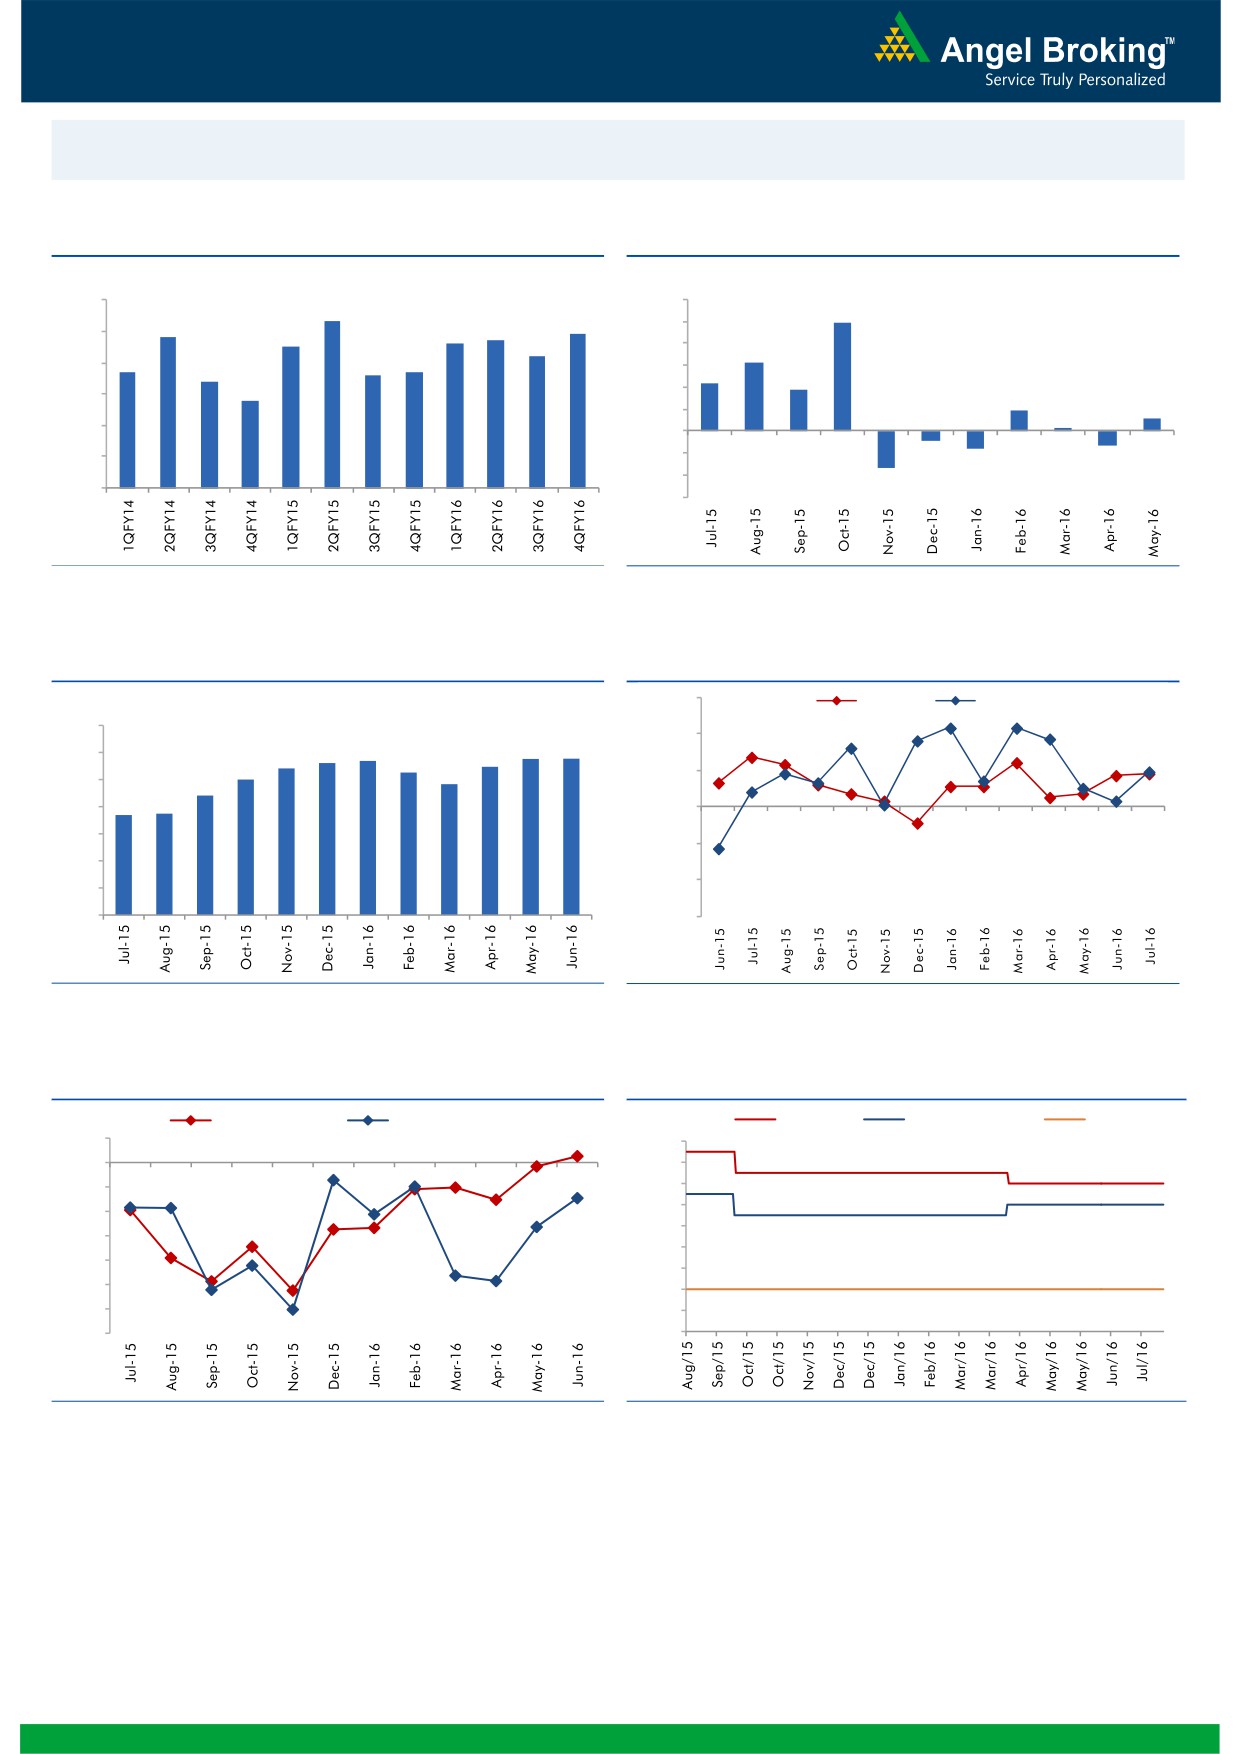
Macro watch
Exhibit 1: Quarterly GDP trends
Exhibit 2: IIP trends
(%)
(%)
9.0
8.3
12.0
9.9
7.8
7.7
7.9
10.0
8.0
7.5
7.6
7.2
8.0
6.3
6.7
6.6
6.7
7.0
6.4
6.0
4.3
3.7
5.8
4.0
6.0
1.9
1.2
2.0
0.3
5.0
-
4.0
(2.0)
(0.9)
(1.3)
(1.6)
(4.0)
3.0
(3.4)
(6.0)
Source: CSO, Angel Research
Source: MOSPI, Angel Research
Exhibit 3: Monthly CPI inflation trends
Exhibit 4: Manufacturing and services PMI
(%)
56.0
Mfg. PMI
Services PMI
7.0
54.0
5.7
5.8
5.8
5.4
5.6
5.5
6.0
5.3
5.0
4.8
52.0
5.0
4.4
3.7
3.7
4.0
50.0
3.0
48.0
2.0
46.0
1.0
-
44.0
Source: MOSPI, Angel Research
Source: Market, Angel Research; Note: Level above 50 indicates expansion
Exhibit 5: Exports and imports growth trends
Exhibit 6: Key policy rates
(%)
Exports yoy growth
Imports yoy growth
(%)
Repo rate
Reverse Repo rate
CRR
5.0
7.50
0.0
7.00
(5.0)
6.50
6.00
(10.0)
5.50
(15.0)
5.00
(20.0)
4.50
(25.0)
4.00
(30.0)
3.50
(35.0)
3.00
Source: Bloomberg, Angel Research
Source: RBI, Angel Research
Market Outlook
August 17, 2016
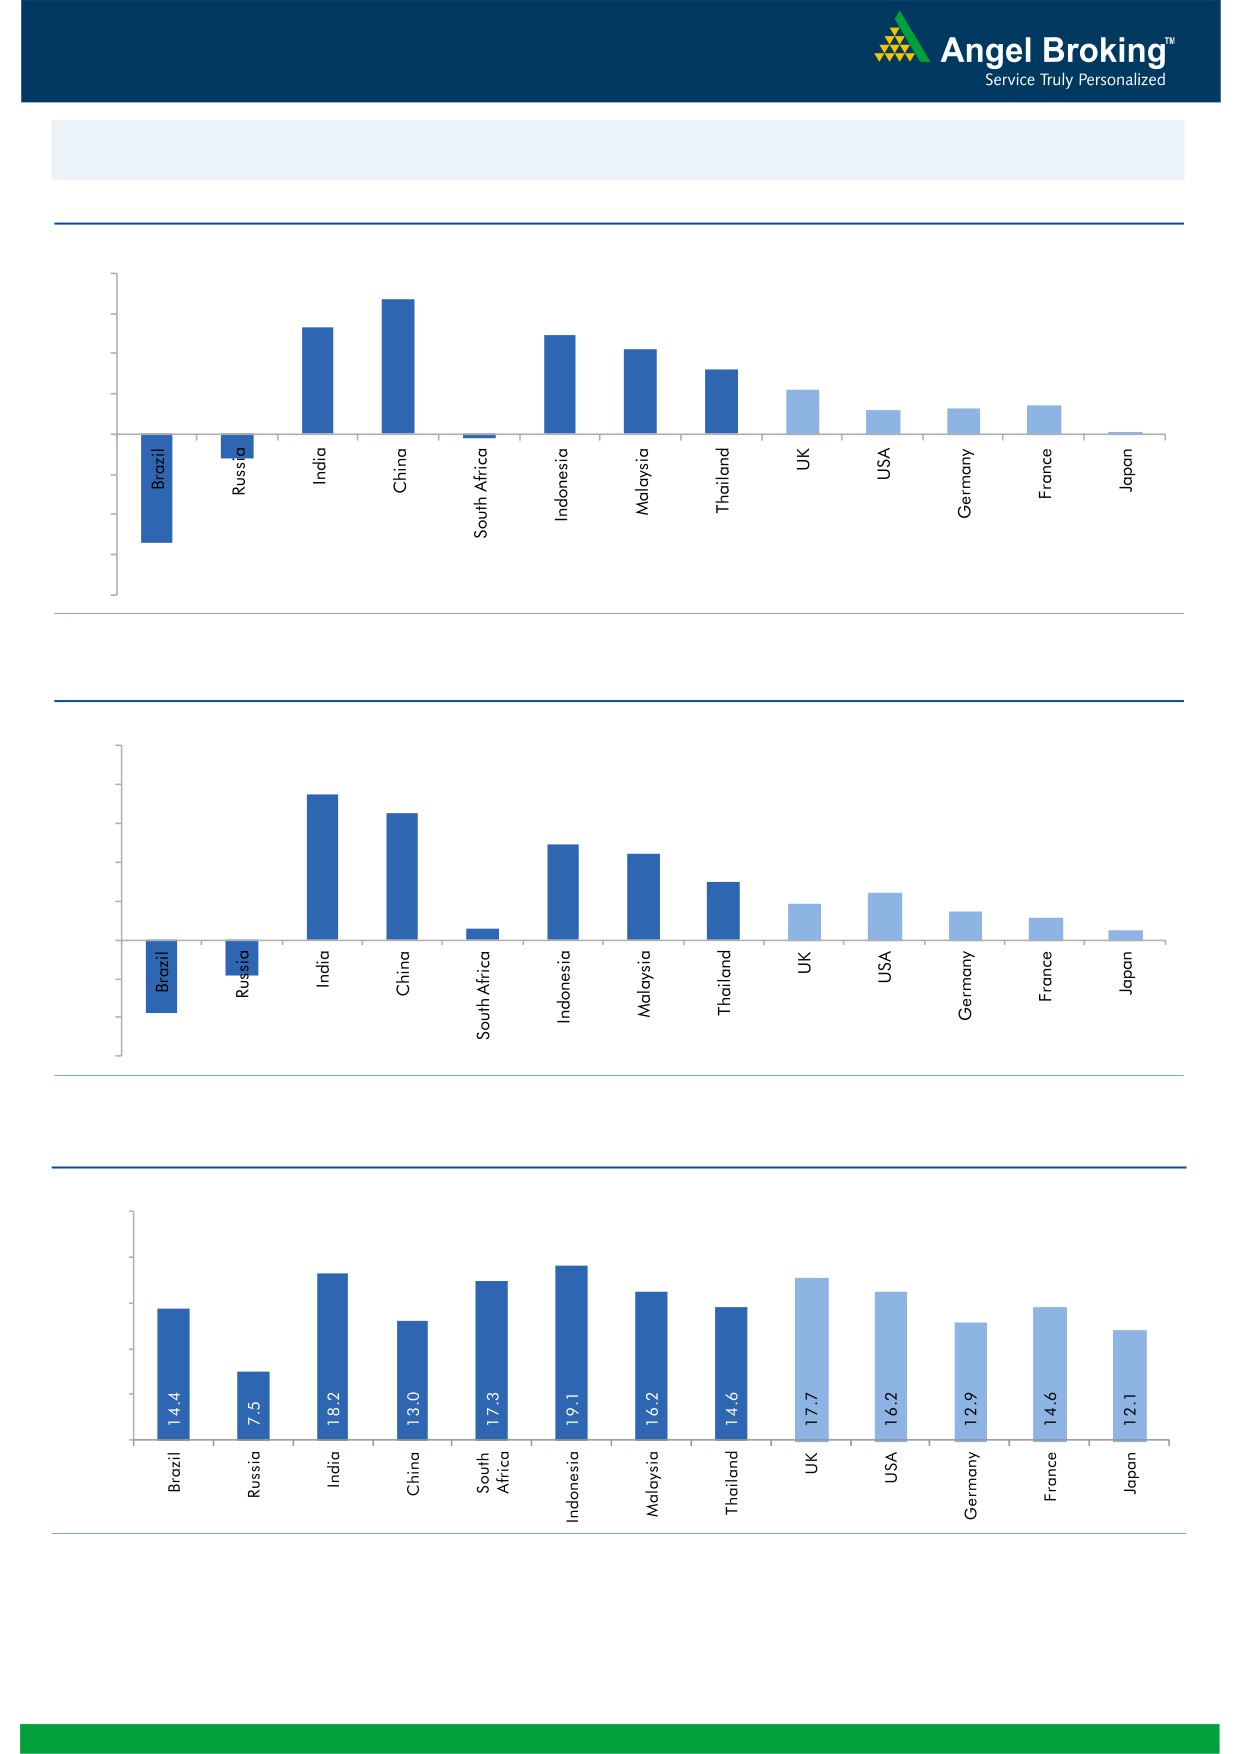
Global watch
Exhibit 1: Latest quarterly GDP Growth (%, yoy) across select developing and developed countries
(%)
8.0
6.7
6.0
5.3
4.9
4.2
4.0
3.2
2.2
1.3
1.4
2.0
1.2
0.1
-
(2.0)
(4.0)
(1.2)
(6.0)
(5.4)
(0.2)
(8.0)
Source: Bloomberg, Angel Research
Exhibit 2: 2016 GDP Growth projection by IMF (%, yoy) across select developing and developed countries
(%)
10.0
7.5
8.0
6.5
6.0
4.9
4.4
4.0
3.0
2.4
1.9
1.5
2.0
1.1
0.6
0.5
(3.8)
(1.8)
-
(2.0)
(4.0)
(6.0)
Source: IMF, Angel Research
Exhibit 3: One year forward P-E ratio across select developing and developed countries
(x)
25.0
20.0
15.0
10.0
5.0
-
Source: IMF, Angel Research
Market Outlook
August 17, 2016
Exhibit 4: Relative performance of indices across globe
Returns (%)
Country
Name of index
Closing price
1M
3M
1YR
Brazil
Bovespa
58,855
5.9
15.8
19.9
Russia
Micex
1,976
1.8
3.5
15.4
India
Nifty
8,643
0.9
9.9
0.9
China
Shanghai Composite
3,110
1.8
9.0
(17.2)
South Africa
Top 40
45,393
(1.9)
(0.0)
(1.1)
Mexico
Mexbol
48,352
3.5
6.1
10.2
Indonesia
LQ45
923
5.2
11.6
11.5
Malaysia
KLCI
1,700
1.9
4.4
1.0
Thailand
SET 50
982
5.5
12.3
4.3
USA
Dow Jones
18,552
0.2
4.8
5.9
UK
FTSE
6,894
3.4
11.8
7.7
Japan
Nikkei
16,870
2.2
0.8
(19.5)
Germany
DAX
10,677
6.1
7.4
2.3
France
CAC
4,460
2.0
3.3
(2.3)
Source: Bloomberg, Angel Research
Stock Watch
August 17, 2016
Company Name
Reco
CMP
Target
Mkt Cap
Sales ( Čcr )
OPM(%)
EPS (Č)
PER(x)
P/BV(x)
RoE(%)
EV/Sales(x)
(Č)
Price ( Č)
( Č cr )
FY17E FY18E
FY17E
FY18E
FY17E
FY18E
FY17E
FY18E
FY17E
FY18E
FY17E
FY18E
FY17E
FY18E
Agri / Agri Chemical
Rallis
Neutral
219
-
4,258
1,937
2,164
13.3
14.3
9.0
11.0
24.3
19.9
4.2
3.7
18.4
19.8
2.2
2.0
United Phosphorus
Accumulate
626
684
26,835
15,176
17,604
18.5
18.5
37.4
44.6
16.7
14.0
3.3
2.7
21.4
21.2
1.8
1.5
Auto & Auto Ancillary
Ashok Leyland
Buy
87
111
24,674
22,407
26,022
10.6
10.6
5.2
6.4
16.6
13.5
3.8
3.2
23.6
24.7
1.2
1.0
Bajaj Auto
Neutral
2,876
-
83,212
25,093
27,891
19.5
19.2
143.9
162.5
20.0
17.7
5.6
4.8
30.3
29.4
2.9
2.5
Bharat Forge
Buy
839
875
19,537
7,726
8,713
20.5
21.2
35.3
42.7
23.8
19.7
4.4
4.0
18.9
20.1
2.2
1.9
Eicher Motors
Neutral
22,462
-
61,008
16,583
20,447
17.5
18.0
598.0
745.2
37.6
30.1
12.8
9.8
41.2
38.3
3.3
2.6
Gabriel India
Neutral
106
-
1,524
1,544
1,715
9.0
9.3
5.4
6.3
19.7
16.8
3.7
3.3
18.9
19.5
0.9
0.8
Hero Motocorp
Neutral
3,295
-
65,791
31,253
35,198
15.3
15.0
172.3
192.1
19.1
17.2
7.0
6.0
38.9
37.0
2.0
1.7
Jamna Auto Industries Neutral
217
-
1,733
1,486
1,620
9.8
9.9
15.0
17.2
14.5
12.6
3.2
2.7
21.8
21.3
1.1
1.0
L G Balakrishnan & Bros Neutral
464
-
728
1,302
1,432
11.6
11.9
43.7
53.0
10.6
8.8
1.5
1.4
13.8
14.2
0.7
0.6
Mahindra and Mahindra Neutral
1,444
-
89,686
46,534
53,077
11.6
11.7
67.3
78.1
21.5
18.5
3.5
3.1
15.4
15.8
1.9
1.6
Maruti
Neutral
4,862
-
146,879
69,186
82,217
14.7
14.4
198.5
241.4
24.5
20.1
4.8
3.9
20.2
20.0
1.8
1.5
Minda Industries
Neutral
1,129
-
1,790
2,728
3,042
9.0
9.1
68.2
86.2
16.6
13.1
3.8
3.0
23.8
24.3
0.7
0.6
Motherson Sumi
Neutral
321
-
42,513
45,896
53,687
7.8
8.3
13.0
16.1
24.6
20.0
7.9
6.3
34.7
35.4
1.1
0.9
Rane Brake Lining
Neutral
648
-
513
511
562
11.3
11.5
28.1
30.9
23.1
21.0
3.5
3.2
15.3
15.0
1.1
1.0
Setco Automotive
Neutral
43
-
573
741
837
13.0
13.0
15.2
17.0
2.8
2.5
0.5
0.4
15.8
16.3
1.3
1.2
Tata Motors
Neutral
507
-
146,352
300,209
338,549
8.9
8.4
42.7
54.3
11.9
9.3
1.9
1.6
15.6
17.2
0.6
0.5
TVS Motor
Accumulate
299
330
14,196
13,390
15,948
6.9
7.1
12.8
16.5
23.4
18.1
5.8
4.6
26.3
27.2
1.1
0.9
Amara Raja Batteries
Buy
903
1,076
15,424
5,717
6,733
18.7
18.9
38.4
48.9
23.5
18.5
5.9
4.8
25.3
24.8
2.5
2.0
Exide Industries
Neutral
175
-
14,867
7,439
8,307
15.0
15.0
8.1
9.3
21.6
18.8
3.0
2.7
14.3
16.7
1.6
1.4
Apollo Tyres
Accumulate
173
183
8,786
12,877
14,504
14.3
13.9
21.4
23.0
8.1
7.5
1.3
1.1
16.4
15.2
0.8
0.8
Ceat
Buy
879
1,119
3,554
7,524
8,624
13.0
12.7
131.1
144.3
6.7
6.1
1.2
1.0
19.8
18.6
0.5
0.5
JK Tyres
Neutral
106
-
2,399
7,455
8,056
15.0
15.0
21.8
24.5
4.9
4.3
1.0
0.8
22.8
21.3
0.4
0.3
Swaraj Engines
Neutral
1,150
-
1,428
660
810
15.2
16.4
54.5
72.8
21.1
15.8
6.6
6.0
31.5
39.2
1.9
1.5
Subros
Neutral
94
-
564
1,488
1,681
11.7
11.9
6.4
7.2
14.7
13.1
1.6
1.4
10.8
11.4
0.6
0.5
Indag Rubber
Neutral
169
-
444
286
326
19.8
16.8
11.7
13.3
14.5
12.7
2.4
2.3
17.8
17.1
1.3
1.1
Capital Goods
ACE
Neutral
43
-
426
709
814
4.1
4.6
1.4
2.1
30.8
20.5
1.3
1.2
4.4
6.0
0.8
0.7
BEML
Buy
1,009
1,157
4,200
3,451
4,055
6.3
9.2
31.4
57.9
32.1
17.4
1.9
1.8
6.3
10.9
1.3
1.1
Bharat Electronics
Accumulate
1,236
1,414
29,659
8,137
9,169
16.8
17.2
58.7
62.5
21.1
19.8
3.3
2.9
44.6
46.3
2.6
2.3
Stock Watch
August 17, 2016
Company Name
Reco
CMP
Target
Mkt Cap
Sales ( Čcr )
OPM(%)
EPS (Č)
PER(x)
P/BV(x)
RoE(%)
EV/Sales(x)
(Č)
Price ( Č)
( Č cr )
FY17E
FY18E
FY17E
FY18E
FY17E
FY18E
FY17E
FY18E
FY17E
FY18E
FY17E
FY18E
FY17E
FY18E
Capital Goods
Voltas
Buy
371
407
12,261
6,511
7,514
7.9
8.7
12.9
16.3
28.7
22.7
5.2
4.5
16.7
18.5
1.5
1.3
BGR Energy
Neutral
113
-
817
16,567
33,848
6.0
5.6
7.8
5.9
14.5
19.2
0.8
0.8
4.7
4.2
0.2
0.1
BHEL
Neutral
137
-
33,618
28,797
34,742
-
2.8
2.3
6.9
59.7
19.9
1.0
1.0
1.3
4.8
0.8
0.5
Blue Star
Neutral
496
-
4,726
4,351
5,024
6.4
7.1
17.2
20.6
28.9
24.0
18.8
15.6
23.1
24.1
1.1
1.0
Crompton Greaves
Neutral
86
-
5,384
5,777
6,120
5.9
7.0
3.3
4.5
26.0
19.1
1.1
1.1
4.4
5.9
0.8
0.7
Greaves Cotton
Neutral
138
-
3,376
1,755
1,881
16.8
16.9
7.8
8.5
17.7
16.3
3.5
3.3
20.6
20.9
1.6
1.5
Inox Wind
Buy
182
286
4,043
5,605
6,267
15.7
16.4
24.8
30.0
7.4
6.1
2.1
1.5
25.9
24.4
0.9
0.8
KEC International
Neutral
139
-
3,571
9,294
10,186
7.9
8.1
9.9
11.9
14.0
11.7
2.1
1.8
15.6
16.3
0.6
0.6
Thermax
Neutral
852
-
10,152
5,421
5,940
7.3
7.3
25.7
30.2
33.2
28.2
4.0
3.7
12.2
13.1
1.7
1.6
VATech Wabag
Buy
573
681
3,126
3,136
3,845
8.9
9.1
26.0
35.9
22.1
16.0
2.8
2.4
13.4
15.9
0.9
0.7
Cement
ACC
Neutral
1,665
-
31,262
11,225
13,172
13.2
16.9
44.5
75.5
37.4
22.1
3.5
3.3
11.2
14.2
2.8
2.4
Ambuja Cements
Neutral
270
-
41,839
9,350
10,979
18.2
22.5
5.8
9.5
46.5
28.4
3.9
3.5
10.2
12.5
4.4
3.7
India Cements
Neutral
121
-
3,726
4,364
4,997
18.5
19.2
7.9
11.3
15.4
10.7
1.1
1.1
8.0
8.5
1.6
1.4
JK Cement
Neutral
767
-
5,367
4,398
5,173
15.5
17.5
31.2
55.5
24.6
13.8
3.0
2.6
12.0
15.5
1.7
1.4
J K Lakshmi Cement
Neutral
433
-
5,095
2,913
3,412
14.5
19.5
7.5
22.5
57.7
19.2
3.6
3.0
12.5
18.0
2.3
1.9
Orient Cement
Neutral
164
-
3,360
2,114
2,558
18.5
20.5
8.1
11.3
20.3
14.5
3.0
2.5
9.0
14.0
2.2
1.7
UltraTech Cement
Neutral
3,738
-
102,597
25,768
30,385
21.0
23.5
111.0
160.0
33.7
23.4
4.3
3.8
13.5
15.8
4.0
3.3
Construction
ITNL
Buy
69
93
2,262
8,946
10,017
31.0
31.6
8.1
9.1
8.5
7.6
0.3
0.3
4.2
5.0
3.6
3.3
KNR Constructions
Neutral
641
-
1,802
1,210
1,595
15.4
16.0
33.9
52.1
18.9
12.3
2.9
2.5
13.6
18.0
1.4
1.0
Larsen & Toubro
Buy
1,505
1,700
140,309
67,665
77,249
10.7
11.5
57.3
71.2
26.3
21.1
2.4
2.3
12.6
14.3
2.2
1.9
Gujarat Pipavav Port
Neutral
179
-
8,646
705
788
52.2
51.7
5.0
5.6
35.8
31.9
3.5
3.2
11.2
11.2
11.3
9.7
MBL Infrastructures
Buy
119
285
494
2,797
3,405
14.7
15.4
21.0
34.8
5.7
3.4
0.6
0.5
11.0
16.2
0.8
0.8
Nagarjuna Const.
Neutral
82
-
4,570
8,842
9,775
9.1
8.8
5.3
6.4
15.5
12.8
1.2
1.1
8.2
9.1
0.6
0.6
PNC Infratech
Buy
114
647
2,928
2,350
2,904
13.4
13.7
48.0
42.0
2.4
2.7
0.5
0.4
16.8
13.2
1.3
1.1
Simplex Infra
Neutral
294
-
1,455
6,829
7,954
10.5
10.5
31.4
37.4
9.4
7.9
1.0
0.9
9.9
13.4
0.6
0.5
Power Mech Projects
Neutral
543
-
799
1,801
2,219
12.7
14.6
72.1
113.9
7.5
4.8
1.4
1.2
16.8
11.9
0.4
0.3
Sadbhav Engineering
Neutral
280
-
4,805
3,598
4,140
10.3
10.6
9.0
11.9
31.1
23.5
3.3
2.9
9.9
11.9
1.7
1.4
NBCC
Neutral
232
-
13,941
7,428
9,549
7.9
8.6
8.2
11.0
28.3
21.1
1.4
1.1
28.2
28.7
1.7
1.2
MEP Infra
Neutral
41
-
660
1,877
1,943
30.6
29.8
3.0
4.2
13.5
9.7
6.6
4.4
0.6
0.6
1.8
1.6
Stock Watch
August 17, 2016
Company Name
Reco
CMP
Target
Mkt Cap
Sales ( Čcr )
OPM(%)
EPS (Č)
PER(x)
P/BV(x)
RoE(%)
EV/Sales(x)
(Č)
Price ( Č)
( Č cr )
FY17E
FY18E
FY17E
FY18E
FY17E
FY18E
FY17E
FY18E
FY17E
FY18E
FY17E
FY18E
FY17E
FY18E
Construction
SIPL
Neutral
98
-
3,434
1,036
1,252
65.5
66.2
(8.4)
(5.6)
3.7
4.2
(22.8)
(15.9)
11.6
9.6
Engineers India
Neutral
223
-
7,507
1,725
1,935
16.0
19.1
11.4
13.9
19.5
16.0
2.7
2.6
13.4
15.3
3.2
2.8
Financials
Axis Bank
Neutral
583
-
139,208
58,081
66,459
3.5
3.5
32.4
44.6
18.0
13.1
2.4
2.1
13.6
16.5
-
-
Bank of Baroda
Neutral
150
-
34,493
19,980
23,178
1.8
1.8
11.5
17.3
13.0
8.7
1.5
1.2
8.3
10.1
-
-
Canara Bank
Neutral
254
-
13,781
15,225
16,836
1.8
1.8
14.5
28.0
17.5
9.1
1.2
1.0
5.8
8.5
-
-
Dewan Housing Finance Buy
263
270
7,671
2,225
2,688
2.9
2.9
29.7
34.6
8.9
7.6
1.4
1.2
16.1
16.8
-
-
Equitas Holdings
Buy
176
235
5,911
939
1,281
11.7
11.5
5.8
8.2
30.4
21.5
2.6
2.3
10.9
11.5
-
-
Federal Bank
Neutral
65
-
11,160
9,353
10,623
2.9
2.9
4.4
5.8
14.8
11.2
1.4
1.3
9.5
11.0
-
-
HDFC
Neutral
1,360
-
214,980
11,475
13,450
3.4
3.4
45.3
52.5
30.0
25.9
5.8
5.1
20.2
20.5
-
-
HDFC Bank
Accumulate
1,226
1,350
310,379
46,097
55,433
4.5
4.5
58.4
68.0
21.0
18.0
3.7
3.1
18.8
18.6
-
-
ICICI Bank
Accumulate
249
254
144,667
39,029
45,903
3.3
3.3
16.7
16.3
14.9
15.3
1.8
1.7
10.1
12.4
-
-
LIC Housing Finance
Accumulate
548
582
27,638
3,712
4,293
2.6
2.5
39.0
46.0
14.0
11.9
2.6
2.3
19.9
20.1
-
-
Punjab Natl.Bank
Neutral
123
-
24,113
23,532
23,595
2.3
2.4
6.8
12.6
18.1
9.8
2.8
2.0
3.3
6.5
-
-
South Ind.Bank
Neutral
21
-
2,890
6,435
7,578
2.5
2.5
2.7
3.1
7.9
6.9
1.0
0.9
10.1
11.2
-
-
St Bk of India
Neutral
246
-
191,314
88,650
98,335
2.6
2.6
13.5
18.8
18.3
13.1
1.7
1.5
7.0
8.5
-
-
Union Bank
Neutral
130
-
8,926
13,450
14,925
2.3
2.3
25.5
34.5
5.1
3.8
0.7
0.6
7.5
10.2
-
-
Yes Bank
Neutral
1,295
-
54,515
8,978
11,281
3.3
3.4
74.0
90.0
17.5
14.4
3.3
2.8
17.0
17.2
-
-
FMCG
Asian Paints
Neutral
1,129
-
108,322
17,128
18,978
16.8
16.4
19.1
20.7
59.1
54.6
20.6
19.4
34.8
35.5
6.2
5.6
Britannia
Neutral
3,271
-
39,247
9,795
10,940
14.1
14.1
80.3
93.0
40.7
35.2
16.8
12.9
41.2
-
3.4
3.0
Colgate
Neutral
954
-
25,956
4,605
5,249
22.8
22.8
25.2
28.5
37.9
33.5
25.7
22.8
64.8
66.8
5.5
4.8
Dabur India
Neutral
298
-
52,475
9,405
10,581
18.1
18.3
8.1
9.2
36.8
32.4
10.3
8.5
31.6
31.0
5.2
4.6
GlaxoSmith Con*
Neutral
6,415
-
26,977
4,959
5,623
17.4
18.0
190.5
219.3
33.7
29.3
9.2
8.0
29.6
29.5
4.8
4.2
Godrej Consumer
Neutral
1,532
-
52,165
10,335
11,518
18.4
18.6
41.5
46.0
36.9
33.3
8.3
7.0
24.9
24.8
5.3
4.7
HUL
Neutral
922
-
199,468
35,252
38,495
17.6
17.4
20.4
21.9
45.1
42.1
37.1
32.5
82.2
77.3
5.4
5.0
ITC
Accumulate
255
283
307,926
40,059
44,439
39.0
39.2
9.1
10.1
28.1
25.3
7.6
6.7
27.2
26.5
7.1
6.4
Marico
Neutral
296
-
38,170
6,730
7,649
17.3
17.5
6.4
7.6
46.2
38.9
14.0
11.7
33.2
32.5
5.5
4.8
Nestle*
Neutral
6,772
-
65,292
9,393
10,507
22.2
22.3
106.8
121.8
63.4
55.6
22.3
20.0
34.8
36.7
6.8
6.0
Tata Global
Neutral
138
-
8,713
9,072
9,687
9.4
9.8
7.2
7.8
19.2
17.7
2.1
2.0
7.6
7.9
0.9
0.9
Procter & Gamble
Buy
6,768
7,369
21,968
2,939
3,342
23.2
23.0
146.2
163.7
46.3
41.3
103.6
99.4
25.3
23.5
6.6
5.7
Hygiene
Stock Watch
August 17, 2016
Company Name
Reco
CMP
Target
Mkt Cap
Sales ( Čcr )
OPM(%)
EPS (Č)
PER(x)
P/BV(x)
RoE(%)
EV/Sales(x)
(Č)
Price ( Č)
( Č cr )
FY17E FY18E
FY17E
FY18E
FY17E
FY18E
FY17E
FY18E
FY17E
FY18E
FY17E
FY18E
FY17E
FY18E
IT
HCL Tech^
Buy
795
1,000
112,148
49,242
57,168
20.5
20.5
55.7
64.1
14.3
12.4
2.9
2.2
20.3
17.9
2.2
1.8
Infosys
Buy
1,051
1,370
241,397
69,934
79,025
27.5
27.5
64.8
72.0
16.2
14.6
3.6
3.3
22.0
22.3
3.0
2.6
TCS
Accumulate
2,691
3,004
530,331
121,684
136,286
27.3
27.3
135.0
150.1
19.9
17.9
6.6
6.1
33.2
33.9
4.1
3.6
Tech Mahindra
Buy
484
700
46,953
30,347
33,685
17.0
17.0
37.5
41.3
12.9
11.7
2.8
2.4
21.8
20.7
1.3
1.1
Wipro
Buy
536
680
132,492
51,631
55,822
21.7
17.9
35.9
36.9
14.9
14.5
3.1
2.9
19.0
18.1
2.3
2.1
Media
D B Corp
Neutral
407
-
7,479
2,187
2,329
27.4
28.2
18.9
21.0
21.5
19.4
4.5
3.9
23.7
23.1
3.2
2.9
HT Media
Neutral
76
-
1,775
2,673
2,891
13.2
13.8
7.2
8.5
10.6
9.0
0.8
0.8
7.8
8.3
0.3
0.2
Jagran Prakashan
Accumulate
182
205
5,950
2,355
2,635
28.0
28.0
9.9
10.8
18.4
16.9
3.7
3.2
21.7
21.7
2.6
2.3
Sun TV Network
Neutral
459
-
18,083
2,850
3,265
70.1
71.0
26.2
30.4
17.5
15.1
4.5
4.0
24.3
25.6
6.0
5.1
Hindustan Media
Neutral
270
-
1,979
1,016
1,138
21.5
21.5
23.3
25.8
11.6
10.5
1.9
1.7
16.2
15.8
1.3
1.1
Ventures
TV Today Network
Buy
290
363
1,731
637
743
27.5
27.5
18.4
21.4
15.8
13.6
2.8
2.3
17.4
17.2
3.8
3.1
Metals & Mining
Coal India
Neutral
338
-
213,493
84,638
94,297
21.4
22.3
24.5
27.1
13.8
12.5
5.7
5.5
42.6
46.0
1.9
1.7
Hind. Zinc
Neutral
227
-
96,105
14,252
18,465
55.9
48.3
15.8
21.5
14.4
10.6
2.3
2.1
17.0
20.7
6.2
4.8
Hindalco
Neutral
154
-
31,842
107,899
112,095
7.4
8.2
9.2
13.0
16.8
11.9
0.8
0.8
4.8
6.6
0.8
0.7
JSW Steel
Neutral
1,749
-
42,269
53,201
58,779
16.1
16.2
130.6
153.7
13.4
11.4
1.8
1.6
14.0
14.4
1.5
1.3
NMDC
Neutral
100
-
39,647
6,643
7,284
44.4
47.7
7.1
7.7
14.1
13.0
1.2
1.2
8.8
9.2
3.9
3.5
SAIL
Neutral
46
-
19,040
47,528
53,738
(0.7)
2.1
(1.9)
2.6
17.7
0.5
0.5
(1.6)
3.9
1.3
1.1
Vedanta
Neutral
169
-
50,237
71,744
81,944
19.2
21.7
13.4
20.1
12.7
8.4
1.1
1.0
8.4
11.3
1.1
0.8
Tata Steel
Neutral
379
-
36,828
121,374
121,856
7.2
8.4
18.6
34.3
20.4
11.1
1.3
1.2
6.1
10.1
0.9
0.9
Oil & Gas
Cairn India
Neutral
200
-
37,422
9,127
10,632
4.3
20.6
8.8
11.7
22.7
17.1
0.7
0.7
3.3
4.2
5.3
4.4
GAIL
Neutral
372
-
47,213
56,220
65,198
9.3
10.1
27.1
33.3
13.7
11.2
1.3
1.2
9.3
10.7
1.0
0.9
ONGC
Neutral
235
-
201,140
137,222
152,563
15.0
21.8
19.5
24.1
12.1
9.8
1.0
1.0
8.5
10.1
1.7
1.5
Petronet LNG
Neutral
320
-
24,030
-
0
-
-
-
-
-
-
Indian Oil Corp
Neutral
545
-
132,214
373,359
428,656
5.9
5.5
54.0
59.3
10.1
9.2
1.6
1.4
16.0
15.6
0.5
0.4
Reliance Industries
Neutral
1,024
-
332,091
301,963
358,039
12.1
12.6
87.7
101.7
11.7
10.1
1.2
1.1
10.7
11.3
1.5
1.3
Pharmaceuticals
Alembic Pharma
Neutral
647
-
12,189
3,483
4,083
20.2
21.4
24.3
30.4
26.6
21.3
6.1
4.8
25.5
25.3
3.4
2.8
Aurobindo Pharma
Buy
735
877
43,019
15,720
18,078
23.7
23.7
41.4
47.3
17.8
15.5
4.6
3.6
29.6
26.1
3.0
2.6
Aventis*
Neutral
4,343
-
10,001
2,357
2,692
17.3
17.3
153.5
169.2
28.3
25.7
4.8
3.9
25.8
28.4
4.1
3.3
Cadila Healthcare
Accumulate
364
400
37,264
11,126
13,148
22.0
22.0
17.1
20.0
21.3
18.2
5.5
4.3
28.8
26.6
3.4
2.8
Stock Watch
August 17, 2016
Company Name
Reco
CMP
Target
Mkt Cap
Sales ( Čcr )
OPM(%)
EPS (Č)
PER(x)
P/BV(x)
RoE(%)
EV/Sales(x)
(Č)
Price ( Č)
( Č cr )
FY17E FY18E
FY17E
FY18E
FY17E
FY18E
FY17E
FY18E
FY17E
FY18E
FY17E
FY18E
FY17E
FY18E
Pharmaceuticals
Cipla
Neutral
554
-
44,482
15,378
18,089
17.4
18.4
21.6
27.2
25.6
20.4
3.3
2.9
13.7
15.2
3.0
2.5
Dr Reddy's
Neutral
3,008
-
51,303
16,043
18,119
23.1
24.7
126.0
157.8
23.9
19.1
3.5
3.0
15.7
17.1
3.1
2.7
Dishman Pharma
Neutral
170
-
2,746
1,718
1,890
21.7
21.8
8.7
10.4
19.6
16.4
1.8
1.6
9.3
10.2
2.1
1.8
GSK Pharma*
Neutral
3,049
-
25,822
3,528
3,811
16.6
18.8
51.8
59.4
58.9
51.3
15.8
15.7
26.3
30.6
7.2
6.7
Indoco Remedies
Sell
306
225
2,822
1,112
1,289
18.2
18.2
13.2
15.6
23.2
19.6
4.1
3.5
19.2
19.2
2.7
2.3
Ipca labs
Buy
517
613
6,519
3,303
3,799
15.3
15.3
17.3
19.7
29.9
26.2
2.6
2.4
9.1
9.4
2.1
1.8
Lupin
Accumulate
1,590
1,809
71,663
15,912
18,644
26.4
26.7
58.1
69.3
27.4
22.9
5.3
4.4
21.4
20.9
4.8
3.9
Sun Pharma
Accumulate
783
944
188,432
31,129
35,258
30.0
30.9
28.0
32.8
28.0
23.9
4.3
3.6
18.7
18.9
6.1
5.2
Power
Tata Power
Neutral
77
-
20,704
36,916
39,557
17.4
27.1
5.1
6.3
15.0
12.2
1.3
1.2
9.0
10.3
1.5
1.4
NTPC
Neutral
161
-
132,999
86,605
95,545
17.5
20.8
11.8
13.4
13.7
12.0
1.4
1.3
10.5
11.1
2.9
2.8
Power Grid
Neutral
178
-
92,887
25,763
29,762
74.3
73.1
14.8
17.3
12.0
10.3
1.9
1.7
16.9
17.5
7.9
7.5
Real Estate
MLIFE
Buy
427
554
1,754
925
1,139
18.4
22.3
18.3
33.8
23.4
12.6
1.1
1.0
4.9
8.5
2.7
2.1
Telecom
Bharti Airtel
Neutral
344
-
137,331
105,086
114,808
34.5
34.7
12.2
16.4
28.2
21.0
1.9
1.8
6.8
8.4
2.3
2.0
Idea Cellular
Neutral
95
-
34,064
40,133
43,731
37.2
37.1
6.4
6.5
14.8
14.6
1.2
1.1
8.2
7.6
2.0
1.7
zOthers
Abbott India
Neutral
4,668
-
9,920
3,153
3,583
14.1
14.4
152.2
182.7
30.7
25.6
150.6
128.6
25.6
26.1
2.9
2.5
Bajaj Electricals
Accumulate
245
299
2,472
5,351
6,098
5.7
5.9
12.4
15.7
19.8
15.5
2.9
2.5
14.4
16.1
0.5
0.4
Finolex Cables
Neutral
416
-
6,362
2,883
3,115
12.0
12.1
14.2
18.6
29.3
22.4
15.6
13.6
15.8
14.6
1.8
1.6
Goodyear India*
Buy
539
631
1,243
1,598
1,704
10.4
10.2
49.4
52.6
10.9
10.2
50.4
44.2
18.2
17.0
0.4
57.2
Hitachi
Neutral
1,403
-
3,816
2,081
2,433
8.8
8.9
33.4
39.9
42.0
35.2
33.9
28.3
22.1
21.4
1.8
1.5
Jyothy Laboratories
Neutral
284
-
5,137
1,440
2,052
11.5
13.0
8.5
10.0
33.4
28.4
8.1
7.5
18.6
19.3
3.9
2.7
MRF
Buy
36,116
45,575
15,317
-
0
-
-
-
-
-
-
Page Industries
Neutral
14,061
-
15,683
2,450
3,124
20.1
17.6
299.0
310.0
47.0
45.4
313.2
239.1
47.1
87.5
6.2
4.9
Relaxo Footwears
Neutral
465
-
5,581
2,085
2,469
9.2
8.2
7.6
8.0
61.5
58.5
23.8
20.4
17.9
18.8
2.8
2.4
Siyaram Silk Mills
Buy
1,079
1,347
1,012
1,799
2,040
11.6
11.7
104.9
122.4
10.3
8.8
1.7
1.5
16.4
16.4
0.8
0.7
Styrolution ABS India*
Neutral
554
-
973
1,440
1,537
9.2
9.0
40.6
42.6
13.6
13.0
34.8
31.7
12.3
11.6
0.7
0.6
TVS Srichakra
Buy
2,395
2,932
1,834
2,304
2,614
13.7
13.8
231.1
266.6
10.4
9.0
269.1
211.9
33.9
29.3
0.8
0.7
HSIL
Neutral
339
-
2,448
2,384
2,515
15.8
16.3
15.3
19.4
22.1
17.5
22.0
18.9
7.8
9.3
1.1
1.0
Kirloskar Engines India
Neutral
287
-
4,149
2,554
2,800
9.9
10.0
10.5
12.1
27.3
23.7
11.4
10.8
10.7
11.7
1.2
1.0
Ltd
M M Forgings
Neutral
413
-
498
546
608
20.4
20.7
41.3
48.7
10.0
8.5
56.5
50.0
16.6
17.0
0.8
0.7
Stock Watch
August 17, 2016
Company Name
Reco
CMP
Target
Mkt Cap
Sales ( Čcr )
OPM(%)
EPS (Č)
PER(x)
P/BV(x)
RoE(%)
EV/Sales(x)
(Č)
Price ( Č)
( Č cr )
FY17E
FY18E
FY17E
FY18E
FY17E
FY18E
FY17E
FY18E
FY17E
FY18E
FY17E
FY18E
FY17E
FY18E
zOthers
Banco Products (India) Neutral
199
-
1,426
1,353
1,471
12.3
12.4
14.5
16.3
13.8
12.2
19.0
17.1
14.5
14.6
1.0
112.1
Competent Automobiles Neutral
159
-
98
1,137
1,256
3.1
2.7
28.0
23.6
5.7
6.7
30.6
27.6
14.3
11.5
0.1
0.1
Nilkamal
Neutral
1,173
-
1,751
1,995
2,165
10.7
10.4
69.8
80.6
16.8
14.6
67.0
58.2
16.6
16.5
0.9
0.8
Visaka Industries
Neutral
153
-
242
1,051
1,138
10.3
10.4
21.0
23.1
7.3
6.6
19.6
18.3
9.0
9.2
0.5
0.5
Transport Corporation of
Neutral
342
-
2,620
2,671
2,911
8.5
8.8
13.9
15.7
24.7
21.9
3.4
3.0
13.7
13.8
1.1
1.0
India
Elecon Engineering
Accumulate
58
63
627
1,482
1,660
13.7
14.5
3.9
5.8
14.8
9.9
3.5
3.2
7.8
10.9
0.7
0.6
Surya Roshni
Buy
170
201
744
3,342
3,625
7.8
7.5
17.3
19.8
9.8
8.6
18.6
15.0
10.5
10.8
0.5
0.4
MT Educare
Neutral
131
-
522
366
417
17.7
18.2
9.4
10.8
14.0
12.1
3.1
2.7
22.2
22.3
1.5
1.3
Radico Khaitan
Buy
93
125
1,239
1,659
1,802
13.0
13.2
6.3
7.4
14.7
12.6
1.3
1.2
8.6
9.3
1.2
1.1
Garware Wall Ropes
Neutral
523
-
1,145
898
997
11.9
11.7
29.0
32.9
18.0
15.9
2.7
2.3
14.9
14.6
1.0
0.9
Wonderla Holidays
Neutral
400
-
2,258
287
355
38.0
40.0
11.3
14.2
35.4
28.1
5.1
4.4
21.4
23.9
7.6
6.1
Linc Pen & Plastics
Neutral
258
-
381
382
416
9.1
9.1
13.1
14.7
19.7
17.6
3.3
2.9
16.7
16.3
1.1
1.0
The Byke Hospitality
Neutral
160
-
643
287
384
20.5
20.5
7.6
10.7
21.1
15.0
4.4
3.6
20.7
23.5
2.3
1.7
Interglobe Aviation
Neutral
826
-
29,780
21,122
26,005
14.5
27.6
110.7
132.1
7.5
6.3
44.7
31.9
168.5
201.1
1.4
1.1
Coffee Day Enterprises
Neutral
235
-
4,848
2,964
3,260
20.5
21.2
4.7
8.0
-
29.4
2.7
2.5
5.5
8.5
2.1
1.8
Ltd
Navneet Education
Neutral
100
-
2,389
1,062
1,147
24.0
24.0
6.1
6.6
16.5
15.1
3.4
3.0
20.6
19.8
2.2
2.0
Navkar Corporation
Buy
200
265
2,846
408
612
42.9
42.3
6.8
11.5
29.5
17.4
2.0
1.8
6.9
10.5
8.1
5.4
UFO Moviez
Neutral
509
-
1,405
619
685
33.2
33.4
30.0
34.9
17.0
14.6
2.4
2.0
13.8
13.9
2.0
1.7
VRL Logistics
Neutral
285
-
2,602
1,902
2,119
16.7
16.6
14.6
16.8
19.6
17.0
4.3
3.8
21.9
22.2
1.6
1.4
Team Lease Serv.
Neutral
1,035
-
1,770
3,229
4,001
1.5
1.8
22.8
32.8
45.5
31.5
4.9
4.2
10.7
13.4
0.5
0.4
S H Kelkar & Co.
Neutral
266
-
3,845
1,036
1,160
15.1
15.0
6.1
7.2
43.5
37.0
4.7
4.3
10.7
11.5
3.4
3.0
Quick Heal
Neutral
243
-
1,704
408
495
27.3
27.0
7.7
8.8
31.4
27.7
2.9
2.9
9.3
10.6
3.7
3.1
Narayana Hrudaya
Neutral
303
-
6,195
1,873
2,166
11.5
11.7
2.6
4.0
114.6
76.5
7.0
6.4
6.1
8.3
3.6
3.1
Manpasand Bever.
Neutral
703
-
3,521
836
1,087
19.6
19.4
16.9
23.8
41.6
29.5
5.0
4.4
12.0
14.8
3.9
2.9
Parag Milk Foods
Neutral
320
-
2,689
1,919
2,231
9.3
9.6
9.5
12.9
33.8
24.7
5.3
4.3
15.5
17.5
1.5
1.3
Source: Company, Angel Research; Note: *December year end; #September year end; &October year end; Price as on August 16, 2016
Market Outlook
August 17, 2016
Research Team Tel: 022 - 39357800
DISCLAIMER
Angel Broking Private Limited (hereinafter referred to as “Angel”) is a registered Member of National Stock Exchange of India
Limited,Bombay Stock Exchange Limited and Metropolitan Stock Exchange Limited. It is also registered as a Depository Participant with
CDSL and Portfolio Manager with SEBI. It also has registration with AMFI as a Mutual Fund Distributor. Angel Broking Private Limited is a
registered entity with SEBI for Research Analyst in terms of SEBI (Research Analyst) Regulations, 2014 vide registration number
INH000000164. Angel or its associates has not been debarred/ suspended by SEBI or any other regulatory authority for accessing
/dealing in securities Market. Angel or its associates/analyst has not received any compensation / managed or
co-managed public offering of securities of the company covered by Analyst during the past twelve months.
This document is solely for the personal information of the recipient, and must not be singularly used as the basis of any investment
decision. Nothing in this document should be construed as investment or financial advice. Each recipient of this document should make
such investigations as they deem necessary to arrive at an independent evaluation of an investment in the securities of the companies
referred to in this document (including the merits and risks involved), and should consult their own advisors to determine the merits and
risks of such an investment.
Reports based on technical and derivative analysis center on studying charts of a stock's price movement, outstanding positions and
trading volume, as opposed to focusing on a company's fundamentals and, as such, may not match with a report on a company's
fundamentals. Investors are advised to refer the Fundamental and Technical Research Reports available on our website to evaluate the
contrary view, if any.
The information in this document has been printed on the basis of publicly available information, internal data and other reliable
sources believed to be true, but we do not represent that it is accurate or complete and it should not be relied on as such, as this
document is for general guidance only. Angel Broking Pvt. Limited or any of its affiliates/ group companies shall not be in any way
responsible for any loss or damage that may arise to any person from any inadvertent error in the information contained in this report.
Angel Broking Pvt. Limited has not independently verified all the information contained within this document. Accordingly, we cannot
testify, nor make any representation or warranty, express or implied, to the accuracy, contents or data contained within this document.
While Angel Broking Pvt. Limited endeavors to update on a reasonable basis the information discussed in this material, there may be
regulatory, compliance, or other reasons that prevent us from doing so.
This document is being supplied to you solely for your information, and its contents, information or data may not be reproduced,
redistributed or passed on, directly or indirectly.
Neither Angel Broking Pvt. Limited, nor its directors, employees or affiliates shall be liable for any loss or damage that may arise from
or in connection with the use of this information.